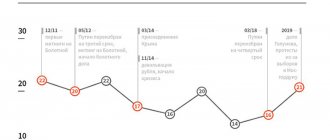
Russia is no exception in this regard. Sociologists from the Federal Research Sociological Center of the Russian Academy of Sciences presented the results of a large-scale study “Capitals and regions in modern Russia: images and reality 15 years later,” summing up the results of work from 2000-2017. Among other things, in the course of surveys, scientists found out how many “indigenous” and “newcomers” actually live in our cities, whether they differ so much and after how many generations the difference disappears.
One clarification: we were not talking about temporary labor migrants, but rather about full-fledged citizens of Russia. The problems of guest workers are a separate and rather painful topic. Moreover, such migrants, as a rule, live in isolation, on a bird’s license, and as soon as a crisis looms on the horizon, they leave en masse a not very populated place. Labor migrants with Russian passports have a different logic of behavior.
Just on the way
Government statistics claim that within the country 3% of citizens change their place of permanent residence every year. It would seem not much. But we must take into account that, as a rule, different people make the move—and over a decade, approximately a quarter of the population sets out on the road.
By the way, you shouldn’t think that Russians travel mainly from villages to cities. On the contrary, city dwellers are twice as mobile in this sense. People move most actively in the Central, Southern, Northwestern and Volga Federal Districts (not surprising, given the location of the two capitals). However, surprise number two: the share of Moscow and St. Petersburg in the volume of total migration now does not exceed 10-15%, this is comparable to their share in the population of the state. Provincial cities are especially seething - their inhabitants are determined to seek their happiness. And if our person decides something, the result will not be long in coming.
How many people in Russia are there who can call themselves “newcomers” - even if they are not in the first generation? It turns out that as many as 68% of the population (that is, more than two thirds) are familiar with migration from their own or parental experience. Most Russians have relatives or friends in other cities. On holidays, many of us congratulate someone across several time zones, go to “help grandma with the housework”... We can’t sit at home. 44% of our fellow citizens, when asked where they would like to live, name something other than the place where they are now. That is, they are ready to “drop everything and go” somewhere... or at least dream about it.
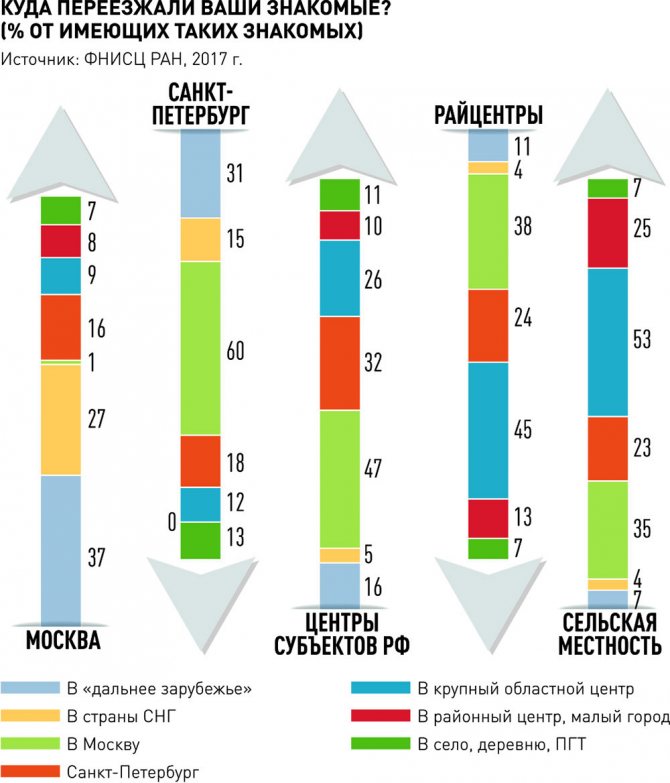
There is no need to explain for a long time why guest workers from other countries or refugees come to Russia. This is clearly evidenced by the queues at bank windows where money transfers abroad are accepted. Inside Russia, people leave their homes for many different reasons, not only economic and financial. For greater objectivity, sociologists asked the question not directly, but indirectly - respondents answered not only about themselves, but also about personal acquaintances who have moved in recent years.
Russians living outside the capitals are ready to leave their homes mainly for the sake of good work. This point was noted by 67% of residents of rural areas and regional centers, 56% of respondents in the centers of constituent entities of the Russian Federation and... 69% in St. Petersburg. The second most important motive is “personal circumstances.” This is the most common reason for leaving Moscow (44%). While 30% of Muscovites personally know those who left for a new job within Russia, 19% know those who left for training. 71% of the surveyed residents of the capital know those who changed their Moscow registration to a foreign one for personal reasons, 25% - those who left here to work abroad, 16% - to study.
In St. Petersburg, 64% of respondents have friends who went to work abroad - this is two and a half times more than in Moscow. St. Petersburg residents go somewhere much less often to study from the Northern capital than Muscovites. And what is the point of looking for good from good, if on the contrary, applicants to universities in St. Petersburg are flocking from all over the country... Career is another matter - it is becoming more and more difficult in the Northern capital.
Sociologists have been conducting their research for more than 15 years. With some adjustments for the peculiarities of counting migrants in different years, we can conclude that something has changed since the early 2000s. People now travel from the provinces to the capitals mainly for a good job; personal motives and education take a back seat. Moscow has become less different from other cities. However, in many respects, St. Petersburg began to resemble a “regional center”, and not a second capital: its residents now change their registration much more often precisely in order to achieve success in the work field, and not to arrange their personal lives, as happened before. The people of St. Petersburg are cramped within the city founded by Peter, just as Peter himself was once cramped within the borders of Rus'. There are many ambitions, much fewer jobs, new horizons and perspectives are required.
What is gratifying is that the intolerance of Soviet times has practically disappeared from everyday life in both capitals. Few people now remember the word “limiters”. When it comes to immigrants from other cities of Russia, our fellow citizens show understanding and tolerance. The attitude towards illegal migrants and guest workers is much harsher. As for those who came to Moscow, say, from Ulan-Ude or to St. Petersburg from Arkhangelsk, they are understood and approved. In many ways - because “they are the same.” Although, of course, every city has its own patriots who like to flaunt their origins. And this applies not only to megacities. Even if someone stranger dares to say something disparaging about the Mariinsky Theater or the Tambov Wolf, about Uryupinsk or Rostov-on-Don... the joker will not find it enough.
Infographics "RG": Leonid Kuleshov / Ekaterina Dobrynina
Influx of migrants to Russia. Ranking of donor countries
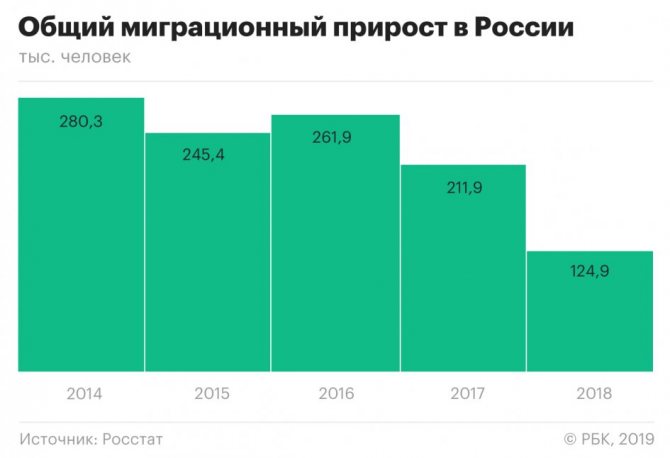
The migration influx to Russia from other countries last year decreased to a minimum since 2005 - 124.9 thousand people, according to Rosstat data. Compared to 2021, migration growth decreased by 41%, or 87 thousand people.
As a result, for the first time in the last ten years, the migration influx could not compensate for the natural decline, and the population of Russia decreased by 93.5 thousand people.
The number of arrivals to Russia in 2021 decreased by 4%, to 565.7 thousand people;
The number of departures increased by 17%, to 440.8 thousand people.
Migration exchange with non-CIS countries took a negative value for the first time since 2006 (minus 4,199 people).
Tajikistan beats Ukraine
For the first time, Tajikistan became the new leader among donor countries: the migration influx from this country exceeded 31 thousand people. Every fourth legal immigrant in 2021 arrived in Russia from Tajikistan.
In second place is Kazakhstan (+26.5 thousand people).
Only in third place is Ukraine (+14.8 thousand). The influx from the republic decreased by more than three times compared to 2021 (from 47.7 thousand). Ukraine has been the leader in the number of migrants arriving in Russia for four years, since 2014.
The reduction in migration influx from Ukraine is due to the exhaustion of the flow of forced migrants from the south-eastern regions of the country, Olga Chudinovskikh, head of the laboratory of population economics at the Faculty of Economics of Moscow State University, explained to RBC. According to her, Ukrainian citizens have changed their migration direction and prefer to go to Europe, for example to Poland.
Uzbekistan still leads in the number of migrants in Russia. According to the Ministry of Internal Affairs, in 2021, 4.5 million citizens of Uzbekistan were registered for migration, and 3.25 million were deregistered (balance: 1.25 million people). In second place are citizens of Tajikistan: 2.33 million people were registered, 1.53 million were deregistered (the balance is almost 800 thousand people).
Migration from legal to illegal
The decline in migration growth in general is due to the fact that Russia is losing its attractiveness for migrants, Chudinovskikh explained. Legal labor migration has decreased greatly due to the increase in the price of a work patent, which is set by the regions.
“Since 2015, the cost of obtaining a patent and the amount of monthly payments have increased significantly. To complete the entire package of documents you need to pay at least 20 thousand rubles. and also pay 4.5 thousand rubles every month,” Chudinovskikh told RBC. Given the low wages, many migrant workers are unable to do this, and the authorities do not support them in obtaining work, housing, or provide social benefits. This leads to the fact that labor migrants prefer to work in Russia illegally. Rosstat records only migrants with legal status.
“If the regions do not change their policy of squeezing money out of migrants, the illegal component will only grow,” the expert concluded.
Accounting flaws
Migration statistics are one of Rosstat’s weak points, and the methodology changed significantly in 2011, making it difficult to compare data before and after 2012. Since 2011, in addition to persons with permanent registration, statistics have included migrants with temporary registration for a period of nine months or more. The change in methodology has led to a sharp increase in incoming migration.
In 2011, migrants whose temporary registration period had expired (nine months or more) were automatically included in the number of those leaving. A significant portion of these migrants actually never leave. That is, emigration from Russia, taken into account in statistics, is largely virtual.
North Korean workers
The balance of migration with non-CIS countries became negative for the first time since 2006: the number of departures (58.9 thousand people) exceeded the number of arrivals (54.7 thousand). The influx of citizens from North Korea decreased the most in 2021 compared to 2017 (1,786 versus 6,031 people).
In September 2021, the UN Security Council prohibited member countries from issuing work permits to citizens of the DPRK. In December of the same year, the Security Council demanded that UN members begin the expulsion of North Korean workers and complete it by the end of 2021. In August 2021, The Wall Street Journal reported that Russia had issued more than 10,000 new work permits to North Korean citizens. In early February, the head of the Ministry of Labor Maxim Topilin said that workers from the DPRK would leave Russia by the end of 2021.
Old-timers won't remember
Sociologists have tried to figure out who is more numerous in Russian cities and villages—the “indigenous” or the “newcomers.” It turned out that these concepts themselves are very relative. The most common model of “migration history” (the majority of such families in every city, regardless of its size) is “old-timers in the second generation.” The parents moved to a new place at one time, and the children were born here or spent their entire adult lives. In Moscow there are 62%, in St. Petersburg - 38%, in regional cities - 40%, in villages - 41%.
There are families where at least two generations have always lived in one place - the respondent’s parents and himself. In Moscow it is 27%, in St. Petersburg and regional centers 34%, in rural areas - 29%. This is what is said about them in the famous joke - “they stayed here!”
The third model of migration history is those “in large numbers” who moved as adults. This is every ninth Muscovite (11%, among them 8% have lived in the capital for more than 10 years and only 1% - less than five), 28% of St. Petersburg residents, 26% of residents of regional centers and 30% of villagers.
For comparison, the data is from 2003, adjusted for different systems for counting immigrants. Over 15 years, the share of indigenous residents in cities has almost doubled (from 18% to 33% in 2017), and the number of Russians who have their own, not their parents’, experience of moving to a new place has decreased by the same amount (from 30% to 16%). residence.
In capitals and large cities there are more and more people who have already lived here for many years and do not want to be a “tumbleweed”
What do these numbers say? First of all, about the fact that in both capitals and large cities there are more and more people who have lived here for many years. This means, sociologists conclude, the scale of intra-Russian migration is gradually decreasing. Younger generations “move around the country” much less than their parents and grandparents. The main reason is that the state stopped practicing all kinds of construction projects of the century, when masses of people (even of their own free will) moved to Siberia, for the construction of the Baikal-Amur Mainline, and so on. There is currently no system of mandatory assignment of university graduates to jobs “wherever they are sent.” Much fewer benefits were provided to young specialists. Economic crises also played a role, when starting your life from scratch in a new place became, to put it mildly, risky.
By the way, during the study, scientists debunked one common myth - that people are fleeing in droves from rural Russia to urban Russia. It turned out that in the villages there are also many who arrived here as adults. In urban settlements there are as many as 37% of such residents. In ordinary villages, 28% are indigenous residents, and 29% are newcomers. The trouble is that people sometimes flee to urban-type settlements from dying villages in the area, and the very urban “lower classes”, whose plans have finally failed, move to the villages themselves. Among those who became village residents relatively recently, a third are people with extremely low incomes, 29% have no higher than secondary education. Those who have lived in the countryside all their lives since birth are not so poor and have studied better. Active youth from villages still strive to leave.
As for the places where “life is good” (and first of all the capitals), they are gradually closing the doors to the mass migration of people from other regions of the country for permanent residence. It is easier to attract guest workers for temporary or rotational work, not least because their work is valued much lower, and they require much less social benefits than ordinary citizens with Russian passports and compulsory medical insurance policies. And while there is a demand for cheap labor from the CIS countries, the supply does not leave itself waiting. This gives rise to a lot of problems - primarily the growth of social and interethnic tension in large cities.
Some statistics
The problem of migration in the world is studied by political scientists, economists, and sociologists. Therefore, today on the Internet you can find reliable statistical data on the number of migrants (including by groups - labor, refugees, etc.), the attitude of residents of certain states towards visitors, and other data. Thus, the main centers of attraction for migrants are Europe and the USA. Further distribution takes place among certain countries (in the case of America, by state).
| European country | Number of refugee migrants who moved in 2015 |
| Germany | 441800 |
| Hungary | 174435 |
| Sweden | 156110 |
| Austria | 85505 |
| Italy | 83245 |
| France | 70570 |
| Other countries | 238335 |
The list of countries by the number of migrants was not compiled by chance. Germany is the most popular among refugees because it pays decent unemployment benefits to “official” migrants. As for Hungary, visitors there mainly intend to stay temporarily in order to save up money and continue their journey deeper into the continent.
One way or another, all of the countries listed above are economically reliable, including others not included in the list:
- Netherlands;
- Belgium;
- Great Britain;
- Switzerland.
| US state | Number of migrants (total) |
| California | 10500000 |
| Texas | 4500000 |
| NY | 4500000 |
| Florida | 4000000 |
| New Jersey | 1900000 |
It is curious that the figures given above are only official statistics: in fact, there are significantly more migrants in all countries. Based on the testimony of law enforcement officers, it can be concluded that at least 107,000 illegal visitors tried to enter European countries in the summer of 2015.
The most developed countries cannot accept everyone, so they are rejecting more and more officially submitted applications. Migrants, realizing that their prospects are becoming increasingly vague, no longer try to apply for refugee status or residence permit. It is therefore curious that the list of countries with the largest number of approved applications differs significantly from the list of countries with a high population of visitors.
| European country | Percentage of applications approved for refugee status |
| Bulgaria | 91 |
| Malta | 91 |
| Netherlands | 86 |
| Denmark | 77 |
| Cyprus | 76 |
| Germany | 72 |
Naturally, when migrants attempt to illegally enter the territory of another state, riots arise. Police report thousands of fights, thefts, and arson. Unfortunately, a crime situation has also established itself in Russia: in 2015, the number of offenses committed by migrants increased by 4.4%, and the total number of crimes by 8.6%. And since the attitude towards immigrants in countries around the world is not the most favorable, many Russians have concluded that the best defense is an attack. As a result, citizens of the Russian Federation began to encroach on the life, health and property of visitors by 17.5% more.
If you are interested in the problems of migrants around the world, but are especially concerned about your home country, read the migration statistics in Russia in more detail. Of course, numbers are just numbers. But based on them, quite fair conclusions can be drawn.
What are the consequences of global migration
The global “migration of peoples” in 2021 has not yet ended - on the contrary, the flow of visitors to European countries may increase significantly in the next two to three years. But despite the incompleteness of the process, it is possible to draw conclusions about the consequences of what is happening now. The simplest and most logical consequence is, of course, a crisis in the economy and demography of each country with mass immigration.
But people who head global and regional migration centers, that is, the rulers of countries and regions where visitors are actively “asking”, also have to monitor price stability, crime and unemployment levels and other factors more carefully. And it is not always possible to react promptly to emerging contradictions.

Thus, the negative consequences of global migration include:
- lowering the cost of labor for migrants - in order to live abroad, migrants, often not even knowing the language of the new country, agree to unskilled labor, and the number of such offers is huge;
- target sectors of the economy of a developed country becoming dependent on foreign labor;
- increased level of xenophobia, conflicts among the civilian population.
However, the influx of immigrants into the country can also contribute to improving relations between states. One way or another, the movement of peoples is a natural process. And if it goes well, the host country wins as a result, as it happens:
- rejuvenation of the nation - mainly young and mature people with families come to work abroad;
- improvement of the demographic situation, as migrants marry, including representatives of the indigenous population;
- economic recovery - the state gets the opportunity to use the funds that visitors store in banks.
Teach a scientist
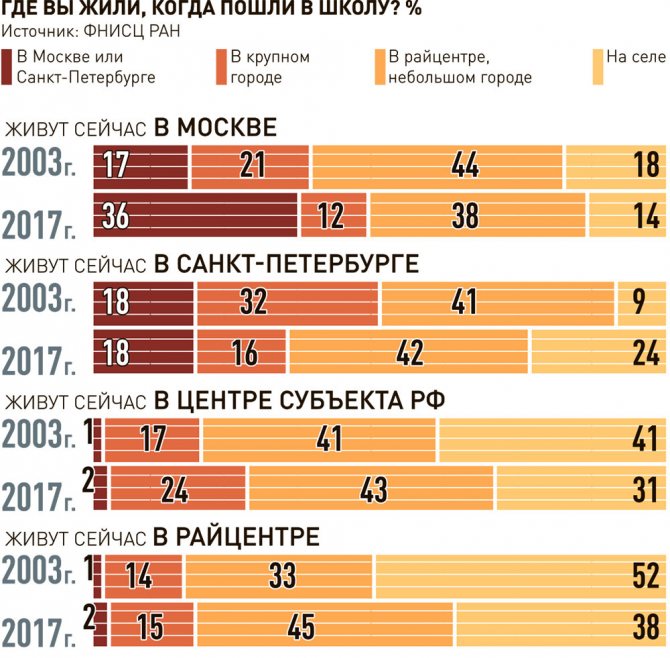
Who are Muscovites? According to surveys, only a third of them (36%) entered the 1st grade of school here in the capital. 12% sat at a desk in a republican or regional center, 38% - in a district center, small or medium-sized city, 14% - in a village or village.
Among St. Petersburg residents, 18% of residents can show a photograph from the first line on September 1 against the backdrop of their home city. 32% began their journey through life in another large, but not capital city, 42% read their primer in the regional center and 9% in a rural school.
A total of 82% of the inhabitants of regional capitals in their youth lived in small and medium-sized cities or villages, only 17% lived in their own city or similar in size. Those who now breathe fresh air in small towns or in rural areas usually began their studies in their native places. Only 14% received school education in a regional or regional center, and then returned “to the land.”
All this is quite important when people begin to communicate with each other. Psychologists call the beginning of schooling the “primary socialization” of a person. It is at this time that the main foundation of his life is laid - a system of values, views on the world around him, behavior, etc. People carry such baggage with them wherever fate takes them. If the new place is not too different from the previous one, the person will easily fit into the new environment. If the difference is large, culture shock and conflicts are inevitable, especially among teenagers and young people.
Russian migrants are helped by the fact that only a few go straight from the village to the metropolitan metropolis. Usually resettlement occurs in “waves” and “steps” - to a settlement of a higher rank. From an urban village to a regional center, from a regional center to a regional center, from a large city to a capital city, etc. People do not feel too sharp a difference between the old and new social circles or value systems. In addition, migration itself has now slowed down, and if in 2003 almost a fifth of the capital’s residents came from rural areas, now they make up only 10-12%. The tension has clearly eased.
Values in the capitals and the hinterlands are indeed very different. This is especially clear when respondents express their views on what qualities should be raised in children.
Only 16% of Russians avoid raising problems and say that “children will choose what they need.” The rest build a clear system of priorities. The top five goals include good education; nurturing honesty and kindness in children; hard work and discipline; development of the child’s mental abilities; building courage and resilience. But in different cities, the order in which these tasks are performed can vary greatly. Emphases have also changed over time.
In 2003, the majority of residents of non-capital cities (81%) believed that children should first of all be given a good education. In the two capitals, 76% shared this opinion. Now education is given much less importance, especially in Moscow - 57%. In St. Petersburg, 69% of citizens say this (a record number), in other cities - 61%.
15 years ago, 46% of residents of the capitals and 53% of other Russians said that it is necessary to cultivate honesty and kindness in children. Now less than a third (31%) of respondents think so (in Moscow 25%, in St. Petersburg 34%).
Nowadays, organization, self-discipline and hard work are valued much less - not half of all parents in the country, but only 30%, that is, less than a third, strive for such commendable results of pedagogical efforts. Positions such as faith in God, civic position and beliefs, courage and perseverance, and even “business acumen” began to appear one and a half to two times less frequently on the list.
There is also something in which Moscow and St. Petersburg stand out sharply from the general background. For Peter, the absolute priority is education (69%), as well as self-discipline (36%), with the national average being 61% and 30%, respectively. Moscow especially values tolerance - 31%, while the average Russian figure is only 16% and St. Petersburg 12%. In other Russian cities, business qualities (37%) and at the same time honesty (30%) are welcomed. In Moscow, these points were noted by 30% and 25%, respectively.
Infographics "RG": Anton Perepletchikov / Ekaterina Dobrynina
| Migration in Russia, results of the first half of 2021 | Leads the column |
| Ekaterina SHCHERBAKOVA |
In January-June 2021, due to migration exchange with CIS countries, the population of 55 out of 85 regions increased, due to migration exchange with other regions of Russia - 17
Despite the fact that the population of Russia has been steadily increasing due to migration growth for 44 years in a row, the population of certain regions has been steadily declining due to migration exchange with other territories.
In the first half of 2021, due to the prevailing migration outflow, the population of the North Caucasus, Volga, Siberian and Far Eastern federal districts decreased. The population of the remaining federal districts increased due to the prevailing migration influx, which was especially significant in the Central Federal District (Table 1).
The main part of migration movements is associated with a change of place of residence within Russia. In migration exchange with other regions of Russia, the leadership in migration attractiveness is held by the Central Federal District, although in recent years it has been worthy of competition from the Northwestern and Southern Federal Districts. The remaining federal districts are losing population in migration exchanges with other Russian territories. The most intense migration decline in intra-Russian migration is still typical for the Far Eastern Federal District, and to a lesser extent for the North Caucasus, Siberian, Volga and Ural Federal Districts.
Due to migration exchange with other countries of the world, primarily with the CIS countries, all federal districts are increasing their population to one degree or another. As for migration exchange with CIS countries, the intensity of migration growth in the first half of 2021 was highest in the Central Federal District, and lowest in the North Caucasus Federal District, where it is close to zero. Population growth due to migration exchange with non-CIS countries is insignificant, and in the Far Eastern, Siberian, Northwestern and Ural Federal Districts, according to data for January-June 2021, there was a slight negative balance of migration.
The leaders in migration turnover in January-June 2021 were two federal districts—Northwestern and Far Eastern—in which the number of arrivals and departures per 1,000 people was 79 each on an annualized basis. The indicator value is noticeably lower in the Siberian (63), Ural (62) and Central (60) federal districts. In other federal districts, the migration turnover of the population is below the Russian average (59 migrants per 1000 people). Its value is lowest in the North Caucasus Federal District (36).
Migration turnover in exchange with CIS countries in January-June 2018 was higher than the Russian average (5.8) in the Northwestern Federal District (8.4), slightly lower in the Far Eastern (8.2) and Central (7.5) Federal District. In other federal districts, its value is noticeably lower - from 1.4 per 1000 people in the North Caucasus Federal District to 5.8 in the Siberian Federal District.
Table 1. Migration in the Russian Federation and federal districts*, January-June 2021 (annualized), per 1000 permanent population
| RF | Central Federal District | Northwestern Federal District | Southern Federal District | North Caucasian Federal District | Volga Federal District | Ural Federal District | Siberian Federal District | Far Eastern Federal District | |
| Migration - total | |||||||||
| Arrived | 30,2 | 32,1 | 41,3 | 27,4 | 16,9 | 26,2 | 30,8 | 30,5 | 38,2 |
| Retired | 29,2 | 27,7 | 38,1 | 24,3 | 19,5 | 28,0 | 30,7 | 32,1 | 40,6 |
| Migration increase | 1,0 | 4,4 | 3,3 | 3,1 | -2,6 | -1,7 | 0,1 | -1,5 | -2,4 |
| Within Russia | |||||||||
| Arrived | 26,5 | 27,2 | 36,0 | 24,0 | 16,0 | 24,0 | 27,3 | 26,9 | 32,6 |
| Retired | 26,5 | 24,4 | 34,3 | 22,1 | 18,6 | 25,9 | 28,6 | 29,3 | 35,8 |
| Migration increase | 0,0 | 2,7 | 1,8 | 1,9 | -2,6 | -1,9 | -1,2 | -2,4 | -3,2 |
| With CIS countries | |||||||||
| Arrived | 3,4 | 4,6 | 5,0 | 2,9 | 0,7 | 2,0 | 3,4 | 3,4 | 4,7 |
| Retired | 2,4 | 2,9 | 3,4 | 1,9 | 0,7 | 1,9 | 2,0 | 2,4 | 3,5 |
| Migration increase | 1,0 | 1,6 | 1,6 | 1,0 | 0,0 | 0,1 | 1,3 | 1,0 | 1,1 |
| With foreign countries | |||||||||
| Arrived | 0,3 | 0,3 | 0,3 | 0,4 | 0,2 | 0,2 | 0,1 | 0,2 | 0,9 |
| Retired | 0,3 | 0,3 | 0,4 | 0,2 | 0,2 | 0,2 | 0,1 | 0,3 | 1,3 |
| Migration increase | 0,0 | 0,1 | 0,0 | 0,2 | 0,0 | 0,0 | 0,0 | -0,1 | -0,4 |
* Central (Central Federal District), Northwestern (Northwestern Federal District), Southern (Southern Federal District), North Caucasian (North Caucasus Federal District), Volga (Volga Federal District), Ural (Ural Federal District), Siberian (Siberian Federal District), Far Eastern (FEFD); Due to rounding, summation results may not reflect the values shown.
Among the regions-subjects of the Russian Federation, a particularly high migration turnover (total, taking into account internal and external migration) in January-June 2021 was noted, as more than once in the past, in the Chukotka Autonomous Okrug (188 arrivals and departures per 1000 permanent population) . The Yamalo-Nenets (126) and Nenets (115) autonomous districts, the Altai Republic, Magadan, Murmansk and Leningrad regions are also distinguished by a high migration turnover of the population (from 100 to 108 arrivals and departures per 1000 people).
In other regions, the value of migration turnover did not reach 90 arrivals and departures per 1000 permanent population, and it was the lowest in Chechnya (24). Migration turnover is also low in the republics of Kabardino-Balkaria (28), Dagestan (29), Ingushetia (30), North Ossetia-Alania (38), Crimea (39). In half of the regions, migration turnover exceeded 64 arrivals and departures per 1,000 permanent population; in the central half of the regions (excluding the 25% of regions with the highest and 25% with the lowest values of the indicator), its value ranged from 51 to 76 per 1,000 people (Fig. 12).
The rate of departure in 53 of the 85 regions-subjects of the federation was higher than the Russian average - 29 per 1000 people. The Chukotka Autonomous Okrug traditionally has the highest relative number of departures (89). The intensity of migration outflow from the Yamalo-Nenets (63) and Nenets (62) Autonomous Okrug, the Magadan (62) and Murmansk (53) regions, the Altai, Kalmykia and Komi Republics is noticeably lower (from 45 to 50 departures per 1000 people).
The lowest intensity of disposal in January-June 2021 was registered in the republics of Ingushetia (12), Chechnya (13), Kabardino-Balkaria (15), Dagestan (17), Crimea (18) and Moscow (18). In other regions, it ranged from 22 departures per 1000 people and higher.
The intensity of entry into the territory was higher than the Russian average - 30 per 1000 people - in 44 regions-subjects of the federation. The highest intensity of entry was registered in the Chukotka Autonomous Okrug (100 arrivals per 1000 people), and in addition, the Yamalo-Nenets Autonomous Okrug (62), Leningrad Region (58), the Altai Republic and the Nenets Autonomous Okrug (53 arrivals per 1000 people each). Human). The lowest intensity of arrivals was observed in the republics of Chechnya (11), Kabardino-Balkaria and Dagestan (12-13), slightly higher in North Ossetia-Alania (16) and Ingushetia (18), in other regions - 21 or more arrivals per 1000 Human.
Figure 12. Migration turnover by regions of the Russian Federation, according to data for January-June 2021, annualized, number of arrivals and departures per 1000 permanent population
List of regions
In terms of the absolute number of arrivals for permanent residence (long-term stay), as in previous years, the undisputed leader, despite the reduction in territory and population as a result of the expansion of the administrative borders of Moscow[13], remained the Moscow region, which in January-June 2021 About 172 thousand people moved in. This is 19% more than in the same period of the previous 2021. The Moscow region is followed by a noticeable margin by Moscow, which has repeatedly become the leader in attracting migrants (158), as well as St. Petersburg (112), Krasnodar Territory (94), the Republic of Bashkortostan (67), Krasnoyarsk Territory (59), Sverdlovsk Region (55) and Leningrad (53) region. In other regions-subjects of the federation, the number of arrivals registered in January-June 2021 did not reach 50 thousand people.
In terms of the number of registered departures, the Moscow region also took first place (128 thousand people in January-June 2018). It is followed almost in the same order by Moscow (113), St. Petersburg (98), the Republic of Bashkortostan (70), Krasnodar (69) and Krasnoyarsk (61) territories, as well as the Sverdlovsk region (55). In other regions, the number of registered departures was less than 50 thousand people.
As a result of migration exchange with other territories - regions of Russia and foreign countries - in the first half of 2018, the population of only 28 out of 85 regions-subjects of the federation increased (Fig. 13). In terms of the intensity of migration growth, the Leningrad region again took first place (17 per 1000 permanent population). The federal city of Sevastopol, which held the lead in this indicator for the last three years, moved to second place (14‰). This is followed by the Moscow region (12‰) and the Chukotka Autonomous Okrug (11‰). In the remaining 24 regions with positive migration growth, its value did not reach 10‰.
In 57 regions-subjects of the federation, according to data for January-June 2018, a migration decline in population was registered. The most intense migration decline was observed in the Magadan region (-16‰). In the Nenets Autonomous Okrug, the Republics of Komi and Kalmykia, the intensity of migration loss ranged from -8 to -10‰.
In absolute terms, the largest population growth due to migration in the first half of 2021 was observed in Moscow (45.2 thousand people) and the Moscow region (44.2). The Krasnodar region (24.5), the Leningrad region (15.7) and St. Petersburg (13.6), the Tyumen region without autonomous okrugs (7.0), and the remaining regions - less than 5 thousand people also received a significant increase in migration.
The most significant migration decline in population in absolute terms for January-June 2021 was recorded in the Republic of Dagestan (-5.9 thousand people) and the Omsk region (-5.4). In the Saratov region it was -4.6 thousand people, in the Orenburg region -4.1, and in other regions - less than 4 thousand people.
Figure 13. Migration population growth in the regions of the Russian Federation, thousands of people for January-June 2021 and per 1000 permanent population according to data for January-June 2021, annualized
List of regions
Most regions - subjects of the Russian Federation replenish their population due to migration exchange with countries - former republics of the USSR (mainly CIS countries), but many of them “lose” population in migration exchange with other regions of Russia, and some in migration exchange with countries of the “far” abroad.
During the first half of 2021, the population of 55 of the 85 regions-subjects of the federation increased due to migration exchange with the CIS countries, in 39 - due to migration exchange with other countries of the world, and the number of regions attracting Russian migrants remained small - 17 (Fig. 14 ).
The intensity of migration growth due to exchange with CIS countries in January-June 2021 was highest in the Kamchatka Territory (11.0 per 1000 permanent population, annualized). It was also quite high in the Kaluga region (7.8), the federal city of Sevastopol (5.6) and the Smolensk region (5.4). In other regions, the migration growth rate was less than 4.5‰. In the Moscow region, the coefficient of migration growth in population exchange with CIS countries was only 2.2‰, in the Krasnodar Territory - 1.3‰, in Moscow - 1.0‰.
A negative balance of migration in exchange with CIS countries has developed in 29 regions, but the intensity of migration loss is, as a rule, low. It was most intense in the Magadan region (-6.0‰), Nenets Autonomous Okrug (-5.1‰), Pskov region (-2.1‰), Novgorod region (-1.5‰), Sakhalin region (-1.2 ‰) and Tambov (-1.0‰) regions.
The increase in population due to migration exchange with other countries of the world (not members of the CIS) is insignificant - the largest migration increase was 1.2‰ in the Astrakhan region. In the remaining 38 regions, migration growth due to population exchange with non-CIS countries did not reach 1‰, and in most was close to zero. Migration loss in exchange with countries outside the CIS was recorded in 40 regions, while it was significant only in the Khabarovsk Territory (-1.3‰) and the Sakhalin Region (-0.6‰) and in other regions did not fall below -0.4‰.
The most intense migration population growth due to exchange with other Russian regions in January-June 2021 was registered in the Leningrad region (15.1‰). It is quite high in the Chukotka Autonomous Okrug (10.9‰), Moscow Region (9.5‰), Sevastopol (8.7‰), Krasnodar Territory (7.2‰), Ingushetia and Moscow (6‰ each), Tyumen (without autonomies) and the Kaliningrad regions, Tyva (5‰ each), and in other regions - less than 3‰.
68 regions lost part of their population in migration exchanges with other regions of Russia. The most intense migration loss in exchange with other Russian regions was registered, as more than once in the past, in the Magadan region (-9.8‰). In the republics of Komi, Kalmykia, North Ossetia-Alania, Kurgan, Omsk, Jewish Autonomous Region and Kamchatka Territory, the migration loss in exchange with other Russian regions was 6-8‰, in other regions the intensity of the migration loss did not reach 6‰.
The median value of the migration growth coefficient in exchange between Russian regions was -2.4‰; in the central half of the regions (excluding the 25% of regions with the highest and lowest values) its value ranged from -0.8‰ to -3.4‰.
Figure 14. Migration growth in the population of the regions of the Russian Federation by individual migration flows, according to data for January-June 2021, annualized, per 1000 permanent population
List of regions
In absolute terms, Moscow received the largest population increase due to migration exchange with other Russian territories in January-June 2018 (38.4 thousand people). It was also high in the Moscow region (35.5 thousand people), Krasnodar region (20.3) and Leningrad region (13.8). In the remaining subjects of the federation, the increase in migration in exchange with other Russian regions did not reach 6 thousand people.
The most significant decline in migration exchange with other Russian territories was noted in the Omsk region (-5.9 thousand people). A slightly smaller migration decline was observed in the Republic of Dagestan (5.7), Orenburg (4.8), Saratov, Kemerovo and Chelyabinsk regions (more than 4 thousand people).
As in Russia as a whole, “internal” migration flows predominate in all regions-subjects of the federation (Fig. 15).
The intensity of immigration from outside the country in January-June 2018, as in 2016-2017, was highest in the Kaluga region (18 arrivals per 1,000 permanent population). It was also high in the Kamchatka Territory (17), Smolensk Region (13), the Republic of Mordovia (10), and in other regions - less than 10‰. The lowest intensity of immigration from outside the country is observed in the republics of Ingushetia, Dagestan and Kalmykia (from 0 to 0.2‰).
In absolute terms, the most immigrants from outside Russia arrived in January-June 2021 in St. Petersburg (19.3 thousand people), Moscow (18.6) and the Moscow region (17.9). 10 thousand immigrants each arrived in the Krasnodar Territory and the Novosibirsk Region, and less than 9 thousand immigrants from abroad each arrived in the remaining regions of Russia.
The highest intensity of internal migration was observed in the Chukotka Autonomous Okrug (98 arrivals per 1,000 permanent population), followed by a noticeable margin by the Yamalo-Nenets Autonomous Okrug (52), the Altai Republic (51) and the Nenets Autonomous Okrug (50). In the remaining subjects of the federation, the number of arrivals from Russian regions did not exceed 43 per 1000 people.
In absolute terms, the largest number of migrants from Russian regions in January-June 2021 was registered, as a year earlier, in the Moscow region (154.1 thousand people). It was also significant in Moscow (139.6), St. Petersburg (92.6) and Krasnodar Territory (83.7). In other regions-subjects of the federation, the number of migrants arriving from regions of Russia did not reach 63 thousand people.
Figure 15. “Internal” and “external” migrants in the regions-subjects of the Russian Federation, according to data for January-June 2018, per 1000 population, annualized
List of regions
In 2021, the number of forced migrants in Russia continued to decline. Rosstat publishes information on forced migrants, refugees and persons granted temporary asylum in accordance with the data of the Russian Ministry of Internal Affairs on persons who have officially received such status in the territorial bodies of the Russian Ministry of Internal Affairs.
The total number of citizens of the Russian Federation who received forced migrant status and foreign citizens who received refugee status increased by the beginning of 1998 to 1,192 thousand.
Among those who received refugee status since the beginning of registration in 1993 - 235.1 thousand people at the beginning of 1998 - the majority were citizens of Tajikistan (50.2), Georgia (46.2), Kazakhstan (40.2), Azerbaijan (33.8) , Uzbekistan (33.0), Kyrgyzstan (16.3). Among the migrants who received forced migrant status since the beginning of registration in 1992—956.9 thousand people at the beginning of 1998—migrants from Kazakhstan (234.2), other regions of Russia (194.3), and Uzbekistan (135.6) predominated. , Tajikistan (126.6), Azerbaijan (68.4), Kyrgyzstan (63.6) and Georgia (60.9 thousand people).
The number of refugees and internally displaced persons in Russia began to decline rapidly since 1999, decreasing by mid-2021 to 13.2 thousand people, including 12.6 thousand internally displaced persons and 598 refugees (Fig. 16). Among forced migrants in Russia, emigrants from Georgia (5.4 thousand people), Kazakhstan (2.4 thousand), other regions of Russia (2.1 thousand) and Uzbekistan (1.2 thousand people) predominate, and among refugees - emigrants from Afghanistan ( 307 people) and from Ukraine (168 people).
In the first half of 2021, 6 people received forced migrant status (12 people during the same period in 2021), 22 people received refugee status (18 people).
Since 2001, registration of foreign citizens and stateless persons who have received temporary asylum (official status) in the territorial bodies of the Ministry of Internal Affairs of Russia began. Until 2014, the number of people who received temporary asylum in Russia did not reach 4 thousand people, but it increased sharply due to the events in south-eastern Ukraine. In 2014, 250 thousand people received temporary asylum in Russia compared to 2822 people in 2013, and in 2015 - almost 150 thousand people. In 2016, the number of people receiving temporary asylum in the Russian Federation decreased to 22.0 thousand people, in 2021 - to 10.4 thousand people. In the first half of 2021, 3,018 people received temporary asylum in Russia (for the same period in 2021 - 5,877 people).
As of July 1, 2021, 103.7 thousand people had temporary asylum status. More than 98% of those granted temporary asylum in Russia are immigrants from Ukraine (101.8 thousand people), about 1% are from Syria (993 people), 0.4% are from Afghanistan (407 people).
Figure 16. Number of forced migrants, thousand people at the beginning of the year*
*2018 – as of January 1 and July 1
Temporary asylum was provided by almost all regions-subjects of the federation, but most of those registered in the Leningrad region and St. Petersburg (total 13.7 thousand people), Krasnodar region (9.8), Voronezh region (9.3), Kaluga region (8 ,1) and Samara (6,1) regions. From 2.8 to 4.6 thousand people found temporary shelter in the Stavropol Territory, Rostov, Nizhny Novgorod, Novosibirsk and Bryansk regions and Moscow.
The largest number of refugees live in Moscow - 421 people, or 70% of the total number.
Forced migrants are settled in almost all regions of the federation, but most of them are in the territory of North Ossetia-Alania (5695 people), as well as in Ingushetia (1495), Samara (569) and Belgorod (377) regions.
[13] The boundaries of the federal city of Moscow and the Moscow region have been changed since July 1, 2012 in accordance with Resolution of the Federation Council of the Federal Assembly of the Russian Federation dated December 27, 2011 No. 560-SF.
| <<< Back | Forward >>> |