After the collapse of the Soviet Union, the demographic situation in many cities worsened significantly. Even where there had previously been a stable increase, the dynamics became negative. Only after some time did the indicators in some regions change to positive. Of course, this was influenced by the improvement in the economic situation, and the gradual stabilization of the situation in the country as a whole. But an increase in the number of inhabitants often ensured not a decrease in mortality and an increase in the birth rate, but rather an increase in migration. The concept means the difference between those who came to a given territory and those who left it over a certain period of time. This material will talk about what migration population growth is and what causes it.
General definition of migration
The very concept of “migration” can be deciphered as a change of place of residence or relocation. This definition is one of the key ones in demographic processes, because the life of the state directly depends on this action. It affects the population of the country and, accordingly, the economic situation.
What is migration growth? The concept is defined in demography as the difference between those who arrived in a territory for permanent residence and those who left it irrevocably.
Migration processes are divided according to several classification criteria:
- to size;
- according to form;
- because of;
- the nature;
- by time;
- by legal status.
| Migration in Russia, preliminary results for 2021 | Leads the column |
| Ekaterina SHCHERBAKOVA |
The amount of migration growth in Russia's population in 2021 exceeded the average value for the period after the VPN-2010
In 2021, the trend of population growth in Russia continued due to the positive migration balance, which has been observed since 1975. In the mid-1970s, migrant flows from the RSFSR to other union republics of the USSR became smaller in terms of the volume of return migration flows, mainly due to the return of the Russian-speaking population from these republics to Russia. After the collapse of the USSR, the balance of migration, which has now become international, increased sharply, reaching its greatest value in the mid-1990s (845.7 thousand people, or 5.7‰ in 1994), after which the intensity of international migration exchange, and as a result migration growth decreased rapidly (Fig. 1). In the mid-2000s, there was a relative stabilization of the indicator, which at the end of the decade gave way to growth, and then stabilization at a higher level and another decline.
Shown in Fig. 1 indicators characterize registered long-term migration with a change of permanent residence. Its volume depends not only on the existing migration potential of possible countries of departure, the socio-economic situation in the countries of entry and exit, but also on the rules for registering migrants and their implementation in practice. In Russia, these rules have been changed several times in recent years[1]. In addition, estimates of migration growth published by the Federal State Statistics Service (Rosstat) were twice significantly increased retrospectively in the process of adjusting the population size based on the results of the All-Russian Population Censuses (RPC) of 2002 and 2010. After the 2010 population census, in order to more fully record migration, the migration criteria were once again changed - expanded: from 2011, the statistical registration of migration for permanent residence began to include persons registered at the place of stay for a period of 9 months or more[2] .
When publishing operational monthly reporting data for 2011, from the total number of arrivals (departures) for permanent residence or long-term stay, migrants registered (de-registered) at their place of residence were identified. Thus, Rosstat published two series of data, one of which is comparable with data from previous years. Subsequently, data on registration at the place of residence was no longer allocated[3]. The change in the criteria for long-term migration led to a significant increase, first of all, in the number of arrivals and net migration (migration growth). Subsequently, due to the changes introduced (primarily the automatic counting of those leaving at the end of their stay and strengthening of sanctions for violation of migration legislation), the number of recorded departures increased to a greater extent. New rules for recording arrivals and departures, according to experts, have led to the emergence of significant volumes of “virtual” migration (accounting events of registration and deregistration, rather than the moves themselves)[4].
In 2011, after the introduction of new accounting rules, the number of people arriving in Russia from other countries for permanent residence or for the purpose of staying for a period of 9 months or more increased, according to Rosstat, by 2.6 times, amounting to almost 357 thousand people versus 139 thousand person according to the previous accounting rules. In 2012, the number of migrants arriving in Russia increased by another 17%, in 2013 – by 15%, in 2014 – by 20% (excluding Crimea[5]). However, in 2015, amid the economic crisis and a significant weakening of the ruble, the number of immigrants to Russia decreased by 0.9%, and in 2021 by another 2.7%.
In 2021, the number of people arriving in Russia from abroad for permanent residence or long-term stay increased slightly again - by 3.0%, to 575 thousand people, excluding Crimea. After VPN-2010, this is second only to the value of 2014 (579 thousand people). Taking Crimea into account, the number of arrivals to Russia increased by 2.4%, to 589 thousand people. In 2021, the number of arrivals to Russia from abroad, on the contrary, decreased by 4.0%, to 566 thousand people (by 3.8%, or to 553 thousand people excluding Crimea).
According to data for January-December 2021, the number of people arriving in Russia from other countries for permanent residence or long-term stay has increased significantly, increasing by 23% (696.4 thousand people, including 680.3 thousand people excluding Crimea).
The number of those who left Russia for permanent residence or long-term stay in other countries changed with a certain lag compared to the number of arrivals. In 2011, it increased by only 13%, and in 2012 by 3.3 times, which is directly related to the change in the procedure for recording long-term migration, since migrants whose period of stay according to their documents has expired were automatically included in the number of those who left. In 2013, the number of emigrants from Russia increased by another 52%, in 2014 - by 66%, in 2015 - by 14%. The increase in the number of people leaving Russia in 2014-2015 was to a certain extent due to the worsening economic situation in Russia. The reduction in the number of people leaving Russia began a year later than the reduction in the number of arrivals. In 2021, the number of people leaving Russia was 313 versus 353 thousand people in 2015 (-11.3%), and excluding Crimea - 311 versus 353 thousand people (-11.8%). However, the very next year, the number of people leaving Russia again increased noticeably (by 20%), amounting to 377 thousand people in 2021 (373 thousand people excluding Crimea). The rapid increase in the number of departures continued in 2018, when almost 441 thousand emigrants were counted (433 thousand people excluding Crimea). This is the highest number of recorded departures from Russia since 1993. In 2021, the number of departures decreased by 7% - in January-December, about 410.6 thousand people were counted (403.0 thousand people excluding Crimea).
As for net or net migration, we note that, as a result of the rapid growth of recorded arrivals, the migration increase in the population of Russia in 2011 amounted to almost 320 thousand people, which is twice the value of the figure for 2010. In 2012, due to a faster growth in the number of departures, the amount of migration growth decreased by 7.8%, and in 2013 it remained almost at the same level as in 2012, increasing by 0.3% (296 thousand people).
Since 2014, the reduction in migration growth in Russia's population has resumed. Its value, excluding Crimea, decreased in 2014 by 8.7%, in 2015 - by 18.5%, amounting to 270 and 220 thousand people, respectively. Per 10 thousand permanent population, migration growth decreased in 2015 to 15.3, which is lower than the values not only of 2011-2014, but also the values of migration growth in 1992-2010, adjusted based on the results of the 2002 and 2010 censuses. After an increase in 2021 (by 12%), the reduction continued in 2021, and in 2021 it increased noticeably - migration growth amounted to only 119 thousand people excluding Crimea and 125 thousand people including Crimea (-41% compared to 2021 ). The migration growth rate decreased, respectively, to 7.8 and 8.5 per 10,000 people - lower values were recorded only in 2001-2005 according to the previous rules for recording migration for permanent residence (excluding those registered for long-term stay and without adjustments according to data VPN-2010).
A significant increase in the number of arrivals to Russia in 2021, while a simultaneous decrease in the number of departures, led to an increase in migration population growth by 2.3 times - up to 285.8 thousand people (277.3 thousand people excluding Crimea), or 19.5 (19. 2) per 10 thousand people. Rosstat specialists attribute such a sharp increase to a more complete provision of information on migration by the Ministry of Internal Affairs as a result of the introduction in 2021 of new forms of federal statistical observation instead of sheets of statistical registration of arrivals/departures, the provision of which to statistical authorities was not strictly regulated[6].
The magnitude of the migration growth of the Russian population in 2021 exceeded its average value for the period after the 2010 VPN by 11%, and taking into account Crimea, the average value for 2014-2019 - by 22%, being the highest for this period.
Figure 1. Number of arrivals to and departures from Russia (thousands of people) and migration growth (per 10 thousand population), 1980-2019*
* for 2011, data is provided according to the new (2011) and old accounting rules (2011); 2012-2019 - assessment according to new accounting rules (2012-2018 - according to annual development data, 2021 - according to operational data for January-December, excluding information for Crimea); migration growth was calculated: MP (net) - as the difference between the numbers of those arriving in Russia and those leaving Russia according to current records; MP (with adjustments) - as the difference between the general and natural population growth of Russia, taking into account the results of the VPN-2010 [7].
Immigrants arriving in the Russian Federation from abroad are overwhelmingly from countries that are former republics of the USSR. Among those who moved to Russia for permanent residence, the share of immigrants from the countries of the Commonwealth of Independent States (CIS), the Baltics and Georgia ranged from 93% to 97% in 1997-2011 (Fig. 2). Among immigrants taken into account according to the criteria changed in 2011, the share of immigrants from the CIS countries, the Baltics and Georgia decreased slightly - to 91-92%, including at least 89% from the CIS countries.
The majority of those arriving in Russia counted before 2011 were its citizens (at least three quarters; in some years this share exceeded 90%[8]). Among immigrants counted under the new rules, the share of Russian citizens dropped by half, amounting to 40% in 2011. It continued to decline in subsequent years, dropping to 23% in 2014, but then began to rise again, increasing to 35% in 2021.
The share of citizens of other CIS countries among immigrants entering Russia, on the contrary, more than doubled, increasing from 20% in 2010 to 50% in 2011. By 2014, it had risen to 68% and then gradually declined, falling below 58% in 2021[9].
Among emigrants from Russia, the share of those heading for permanent residence to neighboring countries was noticeably lower until 2011, ranging from 46% (2004) to 67% (2007). In 2011, it was 61% among emigrants registered when deregistering at their place of residence, and 64% among all emigrants registered according to the new rules (at their place of residence and place of stay for a period of 9 months or more). In 2012, the share of those leaving for the CIS and Baltic countries, Georgia, Abkhazia and South Ossetia increased to 80% of the total number of emigrants from Russia and, gradually increasing (except for 2021, when it decreased to 84%), reached almost 89% in 2021.
In 2021, almost 614 thousand people arrived from the CIS countries to Russia, 6.8 thousand people from Georgia, 1.4 thousand people from Abkhazia, and 3.1 thousand people from the Baltic countries. 357 thousand people left Russia for other CIS countries, 3.9 thousand people for Georgia, 1.2 thousand people for Abkhazia, 2.5 thousand people for the Baltic countries.
Among the registered emigrants from Russia until 2012, Russian citizens predominated (94-96% in 2002-2010, 80% in 2011). Automatic deregistration upon completion of the period of stay led to an increase in the share of foreign citizens among migrants leaving Russia - up to 84% in 2015 against 18% in 2011 and 2-4% in previous years. It then dropped slightly to 80% in 2021, but has rebounded to 83% in 2021. The share of Russians among emigrants traveling outside Russia, on the contrary, decreased to 15% in 2015. It has increased slightly in recent years, reaching 19% in 2021, 18% in 2021, 17% in 2021[10].
In the migration growth of the Russian population, the share of Russian citizens began to grow again. In the 2000s, it ranged from 72 to 89%. After the criteria were expanded, migration declined, falling to 27% in 2012. Then it began to increase: in 2014 it exceeded 30%, in 2015-2016 it amounted to almost half, in 2021 - 61%, and in 2018, migration growth due to Russian citizens even slightly exceeded the total migration growth of the population (125.1 versus 124.9 thousand people) [11].
Figure 2. Number of arrivals and departures from Russia (international migration) in 1997-2019*, thousand people
* for 2011, data is provided on new and old rules for recording long-term migration; 2012-2019 – according to accounting rules amended in 2011; 2021 – based on data for January-December
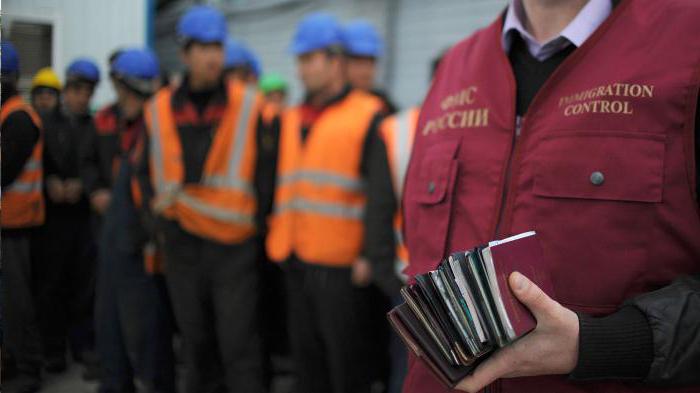
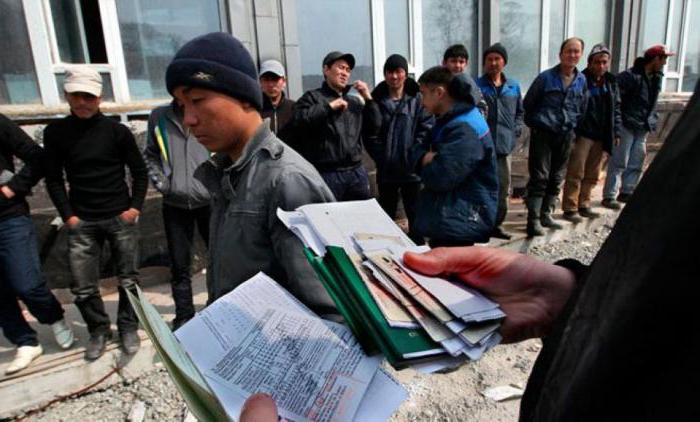
In addition to Rosstat, information on the main indicators of the migration situation in the Russian Federation is published monthly by the Main Directorate for Migration Issues of the Ministry of Internal Affairs of Russia. According to data for January-December 2021[12], 19,518 thousand people were registered for migration in the regions of Russia (10% more than in January-December 2021), including 18,951 thousand people, or 97% - by place of stay, 567 thousand people, or 3%, by place of residence. Of the total number of those initially registered for migration at their place of residence (13,864 thousand people), 40% entered Russia for the purpose of work, 5% for study, 30% for tourism, 25% for private or other purposes.
Among those registered at their place of stay in 2021, immigrants from Uzbekistan (4,740 thousand people, or 25%), Tajikistan (2,653 thousand people, or 14%), China (2,314 thousand people, or 12%) predominated, leading, as well as in the previous 2018, Ukraine (1508 thousand people, or 8%). The number of those registered at the place of stay from other countries was at least half as much.
Among those registered at their place of residence, the majority came from Ukraine (134 thousand people), as well as from Tajikistan (102), Kazakhstan (69), Uzbekistan (65), Azerbaijan (46), Armenia (44), Moldova (27), Kyrgyzstan ( 16) and Belarus (15 thousand people). Less than 10 thousand people moved to Russia from other countries for permanent residence.
In January-December 2021, 16,548 thousand people were removed from migration registration (25% more than in 2021), about 245 thousand decisions were made to issue temporary residence permits (-10%) and 184 thousand decisions to issue (primarily) residence permits for foreign citizens and stateless persons (-3%). Almost 420 thousand people (-18%) live in Russia with valid temporary residence permits, more than 626 thousand (-1%) with valid residence permits. At the same time, more than 250 thousand submissions were sent regarding the prohibition (“non-permission”) for foreign citizens and stateless persons to enter the Russian Federation (-1%).
The number of persons in respect of whom a decision was made to acquire citizenship of the Russian Federation (admission, restoration, recognition) has increased significantly - it has increased to 498 thousand (85% more than in 2021).
[1] For more details, see, for example, Population of Russia 2012: twentieth annual demographic report / rep. ed. A.G. Vishnevsky. M.: Publishing house. House of the Higher School of Economics, 2014. pp. 343-350; Population of Russia 2013: twenty-first annual demographic report / rep. ed. S.V. Zakharov. M.: Publishing house. House of the Higher School of Economics, 2015. pp. 296-297, 329-332. [2] Until 2011, primary statistical records for migrants registered at their place of stay, regardless of the length of stay, were not processed, as noted, for example, in the Demographic Yearbook of Russia. 2012" (p. 402). However, information on the number of migrants registered at their place of stay for a period of 1 year or more was collected by territorial statistical bodies and was taken into account in a certain way when assessing migration growth. This was, in particular, mentioned in the prefaces to the annual releases of the statistical bulletin “Population of the Russian Federation by Cities, Urban Settlement and Districts” for 2005-2010. [3] Data on migration presented in the monthly reports of Rosstat “Socio-economic situation of the Russian Federation” and annual statistical bulletins “Number and migration of the population of the Russian Federation”, according to methodological explanations, were obtained as a result of the development of documents for statistical recording of arrivals and departures coming from territorial bodies of the Ministry of Internal Affairs of the Russian Federation (previously, until 2016 - from the territorial bodies of the Federal Migration Service). Sheets of statistical registration of migrants are compiled when registering and deregistering the population at the place of residence and when registering at the place of stay for a period of 9 months or more. Deregistration is carried out automatically in the process of electronic processing of data on migration of the population when moving within the Russian Federation, as well as after the expiration of the period of stay with migrants, regardless of the place of previous residence. [4] Chudinovskikh O.S. Administrative statistics of international migration: sources, problems and situation in Russia / Questions of Statistics. 2021 No. 2. P. 42-43. [5] Hereinafter, Crimea refers to two subjects of the federation - the Republic of Crimea and the federal city of Sevastopol, formed in accordance with the Federal Constitutional Law of the Russian Federation dated March 21, 2014 No. 6-FKZ and Decree of the President of the Russian Federation dated March 21, 2014 No. 168 within the Russian Federation. Initially they formed the Crimean Federal District, and from July 28, 2021 they became part of the Southern Federal District in accordance with Decree of the President of the Russian Federation No. 375. For the purpose of comparability with data from previous years (until 2014), we use where possible and stipulate this , estimates for the Russian population excluding these two federal subjects. [6] https://www.rbc.ru/newspaper/2019/07/24/5d36c6ef9a7947f42d42668b; https://www.forbes.ru/obshchestvo/380605-rosstat-obyasnil-anomalnyy-rost-pritoka-migrantov-novym-podhodom-k-sboru; https://www.vedomosti.ru/economics/articles/2019/07/23/807137-rossii-skachok-chisla-migrantov. [7] Calculated based on data given in the Appendix to the Russian Statistical Yearbook. 2021 “Socio-economic indicators of the Russian Federation in 1991-2018.” [8] See, for example, “Demographic Yearbook of Russia. 2010". M., 2010. pp. 482-483. [9] “Demographic Yearbook of Russia. 2019." M., 2021. P. 227. [10] Ibid., p. 228. [11] Ibid., p. 229. [12] Selected indicators of the migration situation in the Russian Federation. January 22 12:00 - https://MVD.RF/Deljatelnost/statistics/migracionnaya/item/19364859/, https://MVD.RF/Deljatelnost/statistics/migracionnaya/item/19365693/ (date of access: March 13, 2021 of the year).
| <<< Back | Forward >>> |
Episodic migrations
There are four main types of spatial population movement that determine migration growth.
Episodic migrations periodically affect the number of inhabitants. Thanks to them, at one moment the number of residents in a locality can become many times greater. These are, as a rule, trips related to recreation and tourism, business and others. They have no time frame or set direction. The individuals involved in this type of spatial movement can be quite different. If these are business trips, then, of course, able-bodied citizens travel. But when it comes to recreation, the contingent becomes wider.
Since episodic migration growth is difficult to explain and is only temporary, it is practically not studied. Although this is despite the fact that this type of spatial movement is the most large-scale, especially in the field of tourism.
What classifications exist
The migration balance allows you to determine the rate of mechanical growth.
However, when making calculations, additional nuances should be taken into account. The classification indicator is of great importance. Important! Only current data is used in the calculation and it must be completely reliable.
However, even in this case it is impossible to avoid certain errors. It is for this reason that the classification of indicators is usually divided into absolute and relative.
These values help make more accurate calculations. However, even these should be treated with a small amount of skepticism, with the addition and subtraction of a certain proportion of the number.
Absolute
The absolute category of classification usually includes:
- the total number of persons arriving in the country. The meaning is used both in relation to the entire state and in specific areas and settlements;
- the total number of citizens who left the specified territory for another state for permanent residence or work;
- migration balance - the difference between arrivals and departures;
- volume of migration.
When calculating, internal and external values are used, as well as reference to a specific indicator, such as nationality.
Relative
The following values are usually included in this group:
- arrival rate - a formula is calculated to determine the number of immigrants per population of a thousand people. Formula: “P” is divided by “N” and multiplied by 1000;
- departure rate - denotes the total number of emigrants per 1000 population. It is calculated by the formula: “B” is divided by “H” and multiplied by 1000;
- migration turnover - calculated by adding the number of citizens arriving and leaving the country by a certain number of population. Formula: “P” is added to “B”, the result is divided by “N” and multiplied by 1000;
- balance - a number value for a certain amount of population living in the territory of the state. Calculation: “P” minus “B”, the result is divided by “N” and multiplied by 1000;
- migration efficiency - the indicator is calculated using the values of balance and migration turnover. Expressed as a percentage. Formula: “P” minus “B”, the result is divided by the sum of “P” and “B” and multiplied by 1000;
- relative - the ratio between the number of people arriving and leaving the country, expressed as a percentage. Formula: “P” is divided by “B” and multiplied by 100.
Read also: Emigration to Iceland from Russia
Pendulum migrations
This type of movement is determined by the need of the population for constant travel. Participants in pendulum migration are residents of both urban and rural areas. Most often, this type of migration refers to daily trips to work or study. It is most clearly expressed where there is any possessive center. According to experts, such movement will soon exceed irrevocable resettlement. It is easier for people to get to their destination every day by transport than to buy permanent housing.
Commuting migrations contribute to changes in the structure of labor resources. Thanks to this, vacancies are filled by people living in settlements where there are no job opportunities.
This type of population movement has virtually no effect on migration growth, unless in the process a person decides to change his place of residence.
What is migration balance
This term refers to an indicator that is used to calculate statistical data. According to general rules, this term is usually used to denote the number of citizens of other states who arrived in the state (migrants) and the number of those who left it (emigrants) during a specified period of time. The indicator is usually referred to as absolute, directly related to the total number of people living in a particular region of the country.
According to statistical data for different periods of time, the migration balance indicator can have positive, negative and zero values.
Federal Law of July 18, 2006 No. 109-FZ “On Migration Registration”
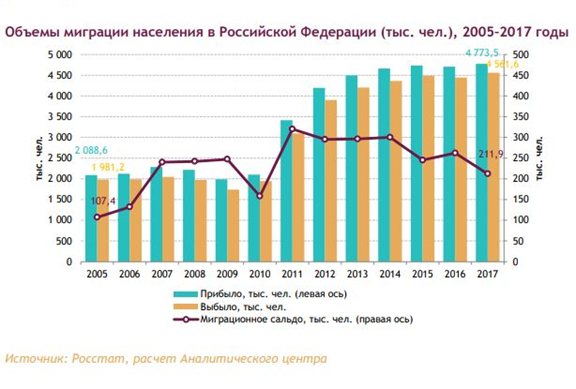
Volumes of population migration in 2005-2017
Positive value
If the indicator becomes positive, this indicates that the number of immigrants arriving in the country exceeds the number of emigrants. Such indicators are more common in large, rich countries that can provide a sufficient number of jobs for visitors and citizens living in the territory.
What does a negative value mean?
A negative value indicates a decrease in the population in the country as a whole. What matters is not only mortality and fertility, but the number of citizens who left the state. The reasons for population decline can be different: environmental disasters, natural disasters, the socio-economic situation in the country. Unemployment is no less important.
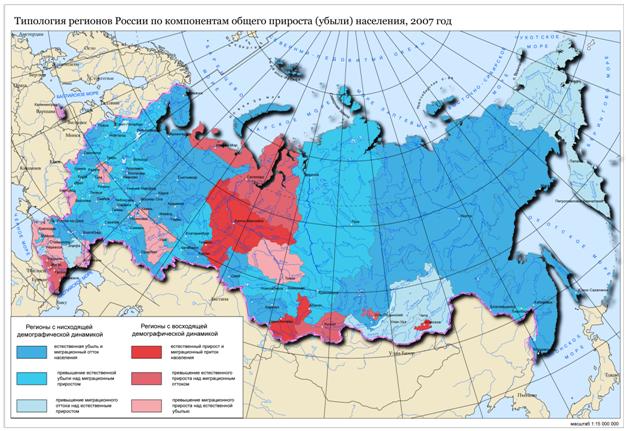
Typology of Russian regions by components of overall population growth (decrease) in 2007
Established Concepts
To understand the process of calculating an indicator, knowledge of basic concepts is required:
- migration is a process in which the population of one country moves beyond its borders for permanent residence in another territory;
- migration balance is an indicator that describes the difference between arriving and departing citizens on the territory of one state in a certain period of time. The calculation can be carried out for a quarter, six months, a year or several years;
- labor migration is a type of relocation to another territory for the purpose of working;
- GDP (gross domestic product) is a factor indicating the cost of goods and services in the market of a particular state in a specified period of time.
Seasonal migrations
This category includes people who, for some reason, were forced to leave their permanent place of residence for an indefinite period. Thanks to this type of movement, the labor shortage is filled and production needs are satisfied. The reason for this process is the uneven distribution of economic levels in the regions. The latter is due to the fact that certain industries generate more income. That is, in such places there is always a need for workers. If local resources cannot replenish it, then additional ones are attracted from other regions.
Most often, this movement is caused by seasonal industries. This is agriculture (mainly sowing and harvesting), logging and coastal fishing.
Types of migration
Depending on the type of migration, the features of migration growth will also differ:
- Episodic migration (leisure travel, tourism, business) has no time frame or direction. Migration is not subject to control and is poorly studied.
- Commuting migration is caused by the population’s need for constant travel (for example, daily trips to work or school). This type of movement does not have a significant impact on migration growth, unless a person decides to change his place of residence.
- Seasonal migration, due to which the labor shortage is filled, production needs are met.
- Irreversible migration, on which the magnitude of migration growth most depends. It represents a permanent move or a complete change of residence.
www.solverbook.com
Permanent migration
Most of all, the magnitude of migration growth depends on this type of population movement. Researchers define it as irrevocable movement, that is, a complete change of place of residence. In order to characterize the process as permanent migration, two points must be met:
- the first is a change of place of residence to another locality, which immediately cuts off travel within a city or village;
- the second is irrevocability, which is the main condition, excluding temporary or short-term trips.
The essence of migration and migration growth
In a simplified way, the concept of “migration” is deciphered as a change of place of residence (moving).
The phenomenon of migration is one of the key concepts of the demographic process, since the functioning of the state is directly dependent on this action. Migration affects the population of a state, determining its economic situation.
The concept of migration growth is designated in demography as the difference between those who arrive in a country (region, territory) for permanent residence and those who permanently leave it.
The migration process is classified according to several criteria:
- size;
- form;
- cause;
- character;
- time parameter;
- legal status.
Types of indicators
There are several indicators that characterize demographic processes, in particular the general migration increase. To analyze statistical data, the concept of “migration balance” is often used. This is an absolute value. It is influenced by the population size in a certain area.
For calculations you will need several coefficients. These include:
- P – number of arrivals to the region.
- B – number of people leaving the region.
- MS – migration net or balance.
The amount of population growth due to migration is calculated very simply. It is equal to the difference between those who arrived and those who left a given territory. That is, in the form of a formula, this can be represented as MS = P-V. This indicator can be both positive and negative. If the number is less than zero, then we are talking about the concept of “migration loss”. For the opposite result, a positive value is required.
The second method is also possible. If the total and natural increase is known, then by subtracting the second from the first, the required value can be obtained. This will be mechanical population growth.
Relative values for specific population groups are also calculated. For example, this is the number of visitors per a certain number of local residents (most often per thousand). In the form of a formula, it looks like Kpr=(P/N)*1000. Kpr is the arrival rate.
To increase accuracy in statistics, it is better to calculate average values over several years. This data is necessary to analyze the current situation, determine immigration policy and manage labor resources.
Relative migration rates
There are general and specific coefficients, as well as indices of the relative intensity of movements for individual groups:
- The arrival rate shows the number of arrivals for every thousand people living in a region in one year:
Kpr=(P/N)x1000
where N is the average annual number of people living in a given territory;
- The departure rate shows how many people have left for every thousand residents in a year:
Cube=(W/N)x1000;
- migration turnover coefficient:
Kmo=((P+V)/N)x1000;
- migration balance coefficient:
Kms=((P-V)/N)x1000;
- migration efficiency coefficient – ratio of balance to turnover as a percentage:
Cam=((P-V)/(P+V))x100
- relative migration balance - the ratio of the number of arrivals to the number of departures as a percentage:
MSo=(P/V)x100
Having made calculations for various groups of residents (age, gender, nationality), we obtain specific characteristics.
You can also calculate averages over several years: this is done in order to avoid random deviations in values. To calculate in this case, average absolute indicators and data on the number of residents for the required period are taken.
To have an idea of what share individual groups occupy in the total number of arrivals or departures, relative intensity indices are calculated for them.
When talking about indicators of statistics on external migration of the population, they use the words “emigration”, “immigration”, and also make calculations for a separate group - labor migrants.
Analysis of such characteristics as the balance of total and labor emigration allows us to see which countries and where labor flows are coming from.
And this, in turn, is important for the formation of an adequate immigration policy and labor management.
>How and where is the easiest way to obtain citizenship: Video
Types of migration
Depending on the type of migration, the features of migration growth will also differ:
- Episodic migration (leisure travel, tourism, business) has no time frame or direction. Migration is not subject to control and is poorly studied.
- Commuting migration is caused by the population’s need for constant travel (for example, daily trips to work or school). This type of movement does not have a significant impact on migration growth, unless a person decides to change his place of residence.
- Seasonal migration, due to which the labor shortage is filled, production needs are met.
- Irreversible migration, on which the magnitude of migration growth most depends. It represents a permanent move or a complete change of residence.
World population growth rate
According to the UN and the US Census Bureau, there are now 7,577,130,400 people in the world. This is 4.9 billion more people than in 1950, when the world's population was about 2.6 billion. In 1987 there were already 5 billion people on Earth, at the end of the twentieth century - 6 billion.
UN experts predict that in 30 years there will be more people on Earth and will amount to 9.7 billion people (2050), and by 2100 - 11 billion people.
Scientists associate the reasons for the rapid growth of the world population with the following factors:
- There are more people surviving to reproductive age.
- Increased fertility rate.
- Rapid pace of urbanization.
- Acceleration of migration processes.
The projections are estimates based on averages, which assume a decline in fertility in countries with large families and a slight increase in fertility in countries with low fertility rates.
Scientists in their forecasts also take into account the fact that in many countries of the world the survival rate and standard of living should increase.
The demographic situation in the world with respect to population distribution is uneven. Thus, in the countries of Asia and Africa, which are among the countries with the highest rates of population growth, 78% of the planet’s population is concentrated (61% in Asia, 17% in Africa).
Europe accounts for only 10%, Latin America and the Caribbean - 8%, North America and Oceania - 5%.
The bulk of population growth over the next 30 years will occur in Africa, where growth rates are higher than in other regions of the world.
The continent has particularly high fertility rates in sub-Saharan Africa. This is despite the fact that fertility rates in Africa have declined.
As in previous forecasts, in 2021 the UN notes that European countries have entered a demographic winter, as a result of which a significant population decline is expected by 2050.
In many European countries, birth rates are low and falling. Here there are 2.1 children for every woman. This is not enough to maintain the population at the desired level.
Now in the world there are on average 2.5 children per woman. This figure will drop to 2.4 by 2050.
Life expectancy in the world has increased, and this trend will continue in the future.
For example, in Africa, people are living 6 years longer than in the early 2000s. Life expectancy statistics by region:
- Africa - 60 years.
- Asia - 72 years old.
- Latin America and the Caribbean - 75 years.
- Europe and Oceania - 77 years.
- North America - 79 years old.
The main causes of mortality are high levels of maternal and child mortality, violence, HIV in the least developed countries, local conflicts and wars, and famine.
Read on our website: countries with high mortality rates.
The influence of fertility and mortality on population changes in countries around the world is heterogeneous. A similar situation is observed with migration. There are countries and regions where migrants do not particularly influence the demographic situation, but there are states where their presence is noticeable.
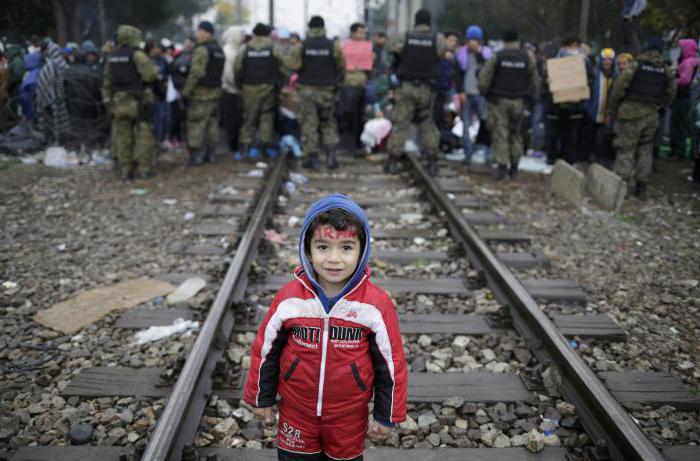
Until 2015, migrants from Africa, Asia, Latin America and the Caribbean emigrated to Europe, Oceania and North America. Then the situation changed, most of the migrants from Syria, Pakistan, African countries, Libya, and Bangladesh are trying to get to the European Union.
The most attractive countries for migrants are Germany, France, Great Britain, Scandinavia (read the links about emigration to a specific country). The main migration routes pass through the Balkans - Greece, North Macedonia, Croatia, Bosnia and Herzegovina, Serbia.
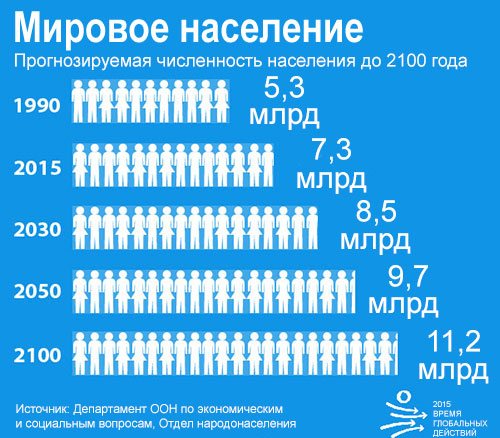
UN Projections for Population in 2100
How to determine migration population growth formula
Mortality is a demographic process that includes the totality of deaths in a population over a certain period of time (usually a year). The mortality rate is influenced by many factors, which are divided into four important groups: 1. natural biological factors - heredity, environmental conditions, etc.; 2. socio-economic factors - lifestyle, standard of living, nature and working conditions, development of the healthcare system, war, etc.; 3. demographic (structural) factors - gender, age, marriage, territorial, etc. population composition; 4. factors that contribute to mortality: smoking, alcohol, drugs, etc. M - Total number of deaths (Characterizes the absolute scale of the mortality process) Mi - Partial number of deaths (Characterizes the composition of the dead by gender, age, territory, months of the year, etc.) Overall mortality rate
(Characterizes the number of deaths per 1000 people of the population)
Private mortality rate
(Characterizes the number of deaths per 1000 people of a private group of the population, for example, men or women)
Age-specific mortality rate
(Characterizes the number of deaths per 1000 people of the same age) - average annual population; — average annual number of men (women); Mx is the number of deaths at a certain age; - average annual population at a certain age. The total and private numbers of deaths reflect the absolute scale of mortality, but say nothing about its intensity. The overall mortality rate, despite its simplicity of calculation and clarity, should be recognized as a rough estimate due to its serious dependence on the structure of the population (primarily, age and gender). The partial mortality rate repeats all the advantages and disadvantages of the general rate. The age-specific mortality rate serves as the most accurate indicator of mortality intensity. If it is calculated differentiated by gender, it eliminates the influence of the gender and age structures of the population.
We recommend reading: Income Tax on Dividends in 2021 for Legal Entities of Foreign PP
= + =-220+383=163
What is migration called
Today, all continents and countries are involved in the process of displacement of peoples. In one form or another, this phenomenon occurs in every populated area, differing only in its intensity, causes and scale. In a broad sense, this term implies the movement of citizens across the borders of various territories.
The main difference between migration and other demographic processes can be considered a quick reaction to the political and socio-economic situation in the country, which contributes to the direction of migrant flows to those territories where life is more stable and secure.
From this we can conclude that the intensity of migration is a criterion that allows us to describe the frequency of migration events in society as a whole over a certain period of time. Intensity coefficients make it possible to compare the dynamics of population mobility in different regions. It goes without saying that the level of intensity is influenced by completely different factors:
- climatic conditions;
- economic situation;
- the opportunity to realize your professional potential;
- political events;
- social security and many others.
The volume of migration makes it possible to obtain quantitative indicators of this process. In addition, he points out the areas that are in greatest demand among people on the move, which allows the governments of the countries in demand to organize an even distribution of migrants in a timely manner.
In general, the process of changing a place of residence includes several stages:
- initial – the procedure for forming population mobility in a particular territory;
- the main one is the movement itself;
- the final one is the adaptation of migrants to new conditions.
Each of these stages has its own characteristics and signs, which form certain indicators of the entire process.

Indicators of migration phenomena
Indicators of labor migration of the population or any other, occurring at a given historical moment, represent numerical characteristics of the entire process at its different stages, used in analyzing the situation with migrants as a whole at the level of one state, region or locality.
These values can characterize both the general level of population mobility and describe the scale, direction and success of migration flows over a certain period of time.
For the most part, these calculated indicators are based on a comparison of absolute characteristics with the average number of the population being studied. To make the comparison more accurate, migration rates are calculated per 1 thousand people in a specific territory.
To more accurately study the processes occurring in society related to a change of place of residence, the system of statistical indicators of international migration operates on a variety of criteria. So, for example, the features inherent in actual migration are divided into three categories:
- general processes that characterize processes that are consolidated for a given territory;
- special ones, indicating the movement of certain socio-demographic groups;
- inter-district exchange data.
All of them include indicators of intensity, power and effectiveness. In general, analysis of data on the migration process makes it possible to find out where, where and in what numbers the inhabitants of a particular territory are moving. To study the entire set of migration processes, absolute and relative indicators of population migration are used.

The key absolute indicators are:
- number of arriving citizens (P) - characterizes the absolute scale of arrival;
- the number of departing residents (B) – characterizes the scale of departure;
- migration turnover (MO) – describes the flow of migrants as a whole.
MO=P+V - migration balance (MB) - gives an idea of the absolute increase or decrease in population.
MS=P-V
At the same time, absolute indicators reflect only the scale of the migration process, but say absolutely nothing about its intensity. This is exactly what relative characteristics are used for. These include:
- coefficient of arriving citizens - the ratio of persons who arrived in a given territory to the average number of citizens living in it:
- the departure rate is the same indicator, but this time relating to retired citizens:
- migrant turnover coefficient - the ratio of the municipality to the average number of residents in a given territory:
- migration balance coefficient - the ratio of MS to the average annual number of residents:
- overall migration efficiency coefficient – ratio of MS to MO:
- relative migration balance - the ratio of arriving citizens to departing citizens as a percentage:
Moreover, both absolute and relative values can be calculated not only for the entire population of the country, but also for its individual groups. For example, for urban residents and for rural residents; for men and women; on a national basis.
We should not forget that the numbers that contain absolute and relative indicators may not coincide due to the fact that the same migrant can move to different territories several times during the period of time being studied.
From this we can conclude that the number of migrations can significantly exceed the number of migrants themselves or be equal to it. One thing is certain - it will never be less.

It should be noted that the formula for gross migration will be the sum of arriving and departing citizens:
MO=P+V.
At the same time, we should not forget that the given coefficients convey only differences in the activity of migrants or their various groups in a strictly defined territory for a certain number of years. But intensity indicators will make it possible to compare these processes in individual territorial areas and in different time periods.
To analyze the final stage of the migration process—settlement—indicators of the mobility of moving persons or the ratio between local residents and settled citizens can be used. It can also be characterized by the average number of years that new settlers have lived in a given territory.
To summarize, we can say that carrying out these calculations allows us to obtain not only a quantitative and qualitative description of the current situation, but also to develop an appropriate political strategy that will allow us to manage these processes.
emigranto.ru
Migration indicators
Although internal migration is typical for all states, in different countries they are at different stages of development. In developing countries, flows of rural residents who do not have land and work rush to cities, and in the most developed countries, “reverse” migrations of the population predominate (from cities to the suburbs, and partly to the countryside).
External migrations, which arose in ancient times, received their greatest development in the era of capitalism. In countries where external migrations of the population become widespread, they can have a significant impact on their numbers, for example in the USA, Canada, Australia, Israel. Currently, inland migration flows have increased. At the same time, labor migration has become especially widespread. This especially affected Western Europe, which from a center of emigration (existing for several centuries) turned into a center of attraction for labor from 7 countries of the Mediterranean and Asia. Important centers of labor immigration are the United States and oil-producing countries in the Middle East.
How to determine migration population growth formula
But natural increase consists of two parts: natural increase, which relates to the population living in the area at the beginning of the period under study, and its offspring, as well as natural increase, which accounts for migrants of different years of settlement.
Another source of population movement in individual regions and the country as an open system is migration. The influence of this source on population changes is unique. Given the known stability of the overall rates of arrival and departure, the results of migration can change over several years in different directions (from negative to positive) and in a wide range of values, and the balance of population migration does not depend on gross turnover, i.e. its total volume. Assessing the role of natural and migration growth in population growth can be done by two methods. The first of them consists of calculating the results of natural movement and migration according to current statistics. Although accounting for both is not entirely accurate, nevertheless, vital statistics are more reliable than population migration indicators. In the sixties, statistical accounting of the migration movement of the population was significantly improved. But in the nineties, its accuracy dropped noticeably. Therefore, now more than ever, the task of increasing the level of reliability of population migration accounting remains urgent.
We recommend reading: Warranty for replaced goods
Master class in geography
The task consists of two parts. To solve the first part of this task, you must use the formula for calculating ppm. T,e value of the natural increase indicator for 2009. – this is -10063 divided by the average annual population of 1313035, and multiplied by 1000 people! EP=-10063/1313035x1000=-0.7663. The assignment tells us to round this number. So the correct answer is -8
As the Earth moves around the Sun
there is a change in the seasons of the year and a change in the length of the day and the height of the Sun above the horizon throughout the year. The main reason is the tilt of the Earth's axis by 66.5 0 and, as a result, a change in the poles of illumination. It is necessary to remember several significant dates and their characteristics:
We recommend reading: Tax official website transport tax